
IMAT ACADEMY RESEARCH LAB · EXAMINATION DATA ANALYSIS REPORT
IMAT 2026 Candidate Performance and Score Distribution Report
A statistical analysis of the exam results of 9,660 candidates who sat the exam outside Italy
IMAT Academy Research Lab · 10 October 2026
9,660
candidate exam results
50.27 / 90
mean score
90.00
highest score
Executive Summary
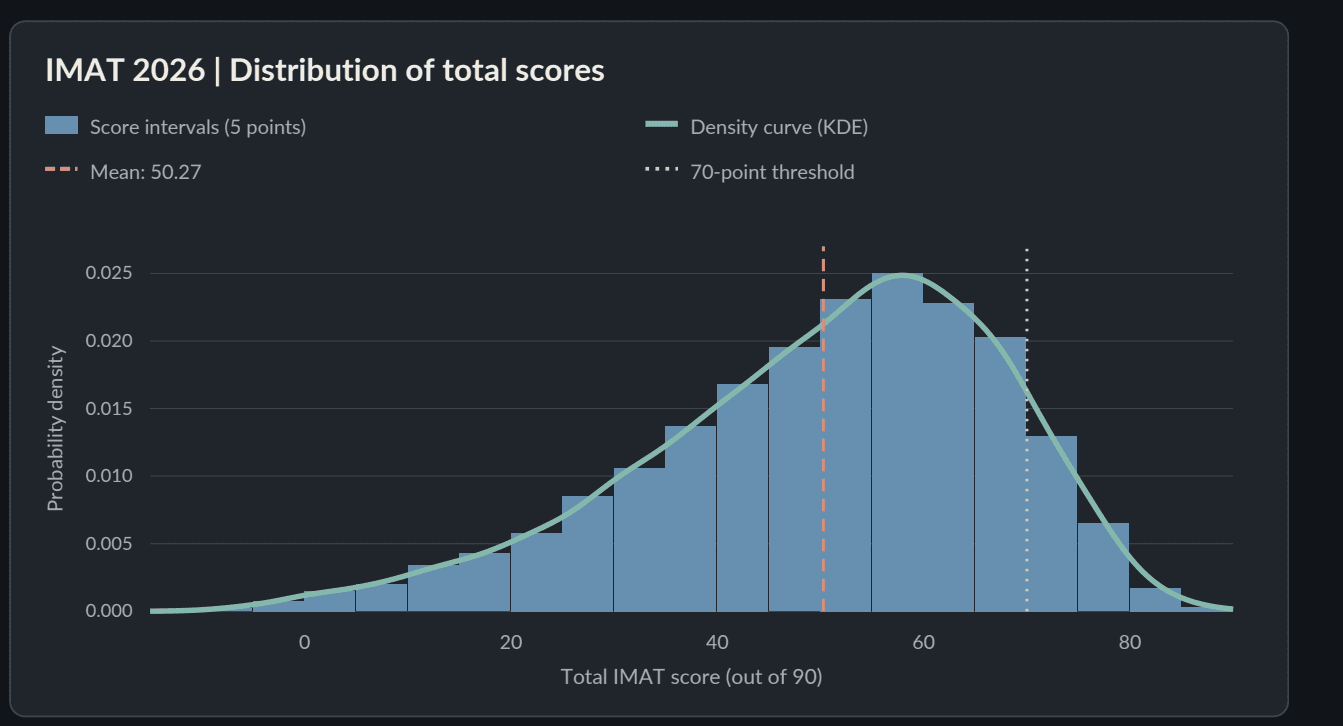
This study examines the distribution of 9,660 results from candidates who sat IMAT 2026 at test centres outside Italy. The mean total score is 50.27, the median is 52.90 and the standard deviation is 17.19. A total of 56.38% of results are at or above 50, while 10.76% are at or above 70.
Important scope note
These results cover test centres outside Italy only. The report does not claim to represent the full IMAT candidate population or the score distribution at test centres within Italy.
Data Scope and Source Integrity
The analysis is based on the scores of 9,660 candidates who sat the exam outside Italy, as published by MUR. The source results file contains 206 pages. The five section scores sum to the reported total score for every candidate row, and no duplicate barcodes were found among barcode-bearing rows.
Two results are marked with an asterisk rather than a barcode, and the source file states that their identity information is awaiting verification. Both are included in the main calculations; excluding them does not change the rounded averages or overall interpretation.
Section-Level Results
| Section | Questions | Maximum score | Average score | Share of maximum |
|---|---|---|---|---|
| Reading | 4 | 6.0 | 2.84 | 47.29% |
| Logical Reasoning | 5 | 7.5 | 3.78 | 50.40% |
| Biology | 23 | 34.5 | 26.27 | 76.13% |
| Chemistry | 15 | 22.5 | 10.54 | 46.86% |
| Physics & Mathematics | 13 | 19.5 | 6.85 | 35.11% |
| TOTAL | 60 | 90.0 | 50.27 | 55.86% |
Because sections contain different numbers of questions, performance is compared using average net score as a share of the maximum possible section score. This is not the percentage of correct answers. Biology has the highest relative mean net score at 76.13%, while Physics & Mathematics has the lowest at 35.11%.
Overall Score Distribution
The density curve shows where candidates cluster in terms of total scores. The histogram represents the concentration of results in each five-point interval.
| Statistic | Score (out of 90) |
|---|---|
| Arithmetic mean | 50.27 |
| Median | 52.90 |
| Lowest score | -12.20 |
| Highest score | 90.00 |
| Standard deviation | 17.19 |
| Lower quartile (25%) | 39.70 |
| Upper quartile (75%) | 63.10 |
The median is 52.90. The middle 50% of results lie approximately between 39.70 and 63.10. Negative net scores are possible because of the penalty for wrong answers, and 49 results are below zero.
Score Thresholds
The thresholds below are cumulative: results at or above 80 are also included in the 70+, 60+ and 50+ groups.
| Threshold | Students | Share of total |
|---|---|---|
| 80 or above | 99 | 1.02% |
| 70 or above | 1,039 | 10.76% |
| 60 or above | 3,119 | 32.29% |
| 50 or above | 5,446 | 56.38% |
| Below 50 | 4,214 | 43.62% |
High, Medium and Low Achievement Distribution
| Achievement level / definition | Students | Share |
|---|---|---|
| High (70–90) | 1,039 | 10.76% |
| Medium (50–69.9) | 4,407 | 45.62% |
| Low (<50) | 4,214 | 43.62% |
These groups are operational categories defined for the analytical presentation in this report. They are not official IMAT eligibility, ranking or university-admission categories.
Key Findings and Their Relevance to IMAT 2027 Preparation
- The most common score band is 50–59.9, containing 2,327 results (24.09%).
- Results at or above 70 account for 10.76%, while only 1.02% reach 80 or above.
- Biology leads in relative mean net performance, while Physics & Mathematics and Chemistry record lower shares of their maximum section scores.
- For IMAT 2027 preparation, these data can help contextualise target and mock-test score ranges; individual study decisions still require student-level, topic-level and item-level evidence.
Method, Scoring and Limitations
- Each correct answer earns +1.5 points, each wrong answer −0.4 points and each unanswered question 0. The report uses the net section and total scores in the source results file.
- Section-level shares do not, on their own, establish item difficulty; they should be read alongside candidate preparation, sample composition and other factors.
- Test centres within Italy are outside the scope. Findings are limited to results from centres outside Italy.
- Programme- or student-level interventions require more detailed student-level or item-level evidence.
Download the Analysis Report
Review the complete tables, distribution chart, methodology notes and findings in the English PDF report.
IMAT Academy Research Lab. (2026). IMAT 2026 Candidate Performance and Score Distribution Report: Statistical Analysis of Results from Test Centres Outside Italy. IMAT Academy.